The standard explanation for Japan's record bear year is that there are simply more bears. The arithmetic does not cooperate. In 2025 Asiatic black bears caused 232 human casualties, 11 of them fatal, the highest toll on record. Yet since 2008, 65,514 bears have been lethally removed; against the only peer-reviewed population estimate, that is 15 to 24% of the population every year, near or above the fastest growth ever documented for bears of its genus.
A new analysis argues that the limiting factor is food, specifically how low its floor has fallen. In five Tohoku prefectures, attacks climb steeply once the autumn beech-nut crop drops below a threshold; since about 2006, beech trees have converted flowers into mature seed less efficiently, so lean years are leaner and cross that threshold more often; and 2025 was a compound failure, with the beech crop and the forest's backup food collapsing together.
Why it matters: Japan has answered the crisis with lethal removal on an unprecedented scale, including more than 14,000 bears killed under nuisance permits and Self-Defense Forces personnel sent to assist hunters. If the surges are episodic food failures, culling targets the wrong variable.
The study, by Xiao et al. at Keio University combines three public datasets: government counts of bear attack events (790 in the five prefectures, 2008 to 2025), the Forestry Agency's beech flowering and fruiting survey at 145 fixed plots, and satellite net photosynthesis, a proxy for the grasses, insects and fruit bears fall back on when nuts are scarce.
A hunger threshold, not a slope
Beech crops are scored on a 0 to 5 scale, and the survey itself calls anything under 1.0 a severe failure. The relationship between this mast index and attacks turned out to be sharply non-linear. A grid search placed the break at 0.38, far below the official failure line: below it, incidents climbed 14.8-fold more steeply than above it, and crisis prefecture-years averaged 15.8 incidents against 5.9 in safe ones. That fits foraging theory: animals accept dangerous ground only once their reserves fall below a critical floor.
Two cautions. The threshold was chosen by grid search, and every value from 0.22 to 0.58 fitted indistinguishably well, so 0.38 is the middle of a wide band. And the slope above it was not statistically significant (P = 0.054).
Where the beech system broke
The more original finding concerns the trees. The average crop since 1990 shows only a marginal decline (P = 0.050), but that hides an asymmetry: the leanest years grew significantly worse while bumper years did not, and the annual odds of falling below the conflict threshold rose by a factor of 1.066 per year (P = 0.016).
Flowering itself has no time trend (P > 0.5). What declined is conversion: a given amount of flowering now yields progressively less mature seed. Two independent change-point methods placed the break at 2006, after which the average conversion residual fell from +0.24 to −0.14 and its spread widened 1.6-fold. The shift moved together across prefectures, which local causes cannot produce. European beech shows the opposite, with both good and bad years rising.
The break coincides with a shift in regional climate: summer mean temperature in Tohoku has not dropped below 19°C in any of the 20 years since. The authors propose that cool summers once vetoed flowering in low-nitrogen years; without the veto, trees flower anyway and fail to fill the seed. They state that pollination failure and other causes cannot yet be ruled out.
Two outbreaks, two mechanisms
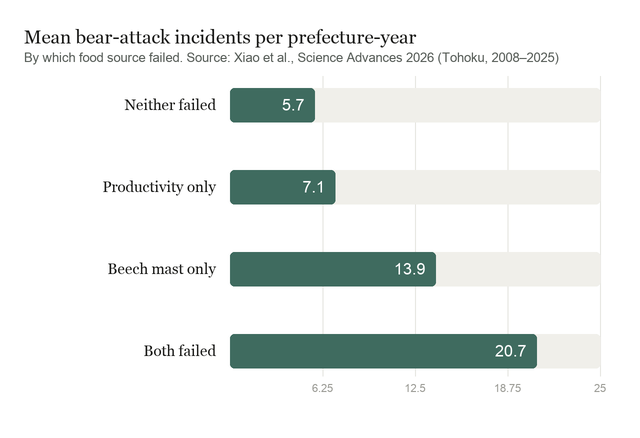
Splitting prefecture-years by which food source was poor, years with neither failure averaged 5.7 incidents, a productivity deficit alone 7.1, a beech failure alone 13.9, and both together 20.7, well above the roughly 15 expected if the two effects simply added.
In both 2023 and 2025 all five prefectures fell below the beech threshold. But in 2023 productivity was normal (mean anomaly +1.4), while in 2025 it collapsed (−58.7, every prefecture more than one standard deviation below baseline). In a held-out test, the interaction model predicted 0.90 times as many incidents as a no-interaction model for 2023, but 2.34 times as many for 2025.
The caveat: the interaction (P = 0.034) loses significance when both years are removed, and the authors note it overstates the effect at the extremes.
How much of the surge this explains
Mapping post-2006 crops back onto the earlier regime, the model attributes 120 of 786 expected incidents (15.3%) to the shift, within 12.2 to 16.1% across plausible thresholds. That is a real but bounded share: roughly five in six incidents are not attributed to it. The apparent 6%-a-year upward trend in attacks lost significance (P = 0.138) once 2023 and 2025 were set aside, which the authors read as evidence that conflict is episodic rather than a steady demographic climb.
What the study can't say yet
This is an observational panel of 90 prefecture-years, and 10 of them account for roughly a third of all incidents. The productivity index does not identify which fallback food matters. The analysis covers Tohoku only. The temperature link is a coincidence in timing, and the veto physiology is untested.
The study also does not count bears; its case against the policy estimate of about 42,000 bears is a critique of another model, and its doubts about culling draw on prior studies rather than a test. On forecasting the authors are specific: Forecasting systems that monitor only mast availability will therefore miss compound-channel years entirely while still catching severe single-channel ones.
Quick questions
So are there more bears in Japan or not? Unresolved. The authors propose measuring it directly from the carcasses already being collected.
Is climate change causing the beech failures? The 2006 break fits a warming mechanism, but the physiology has not been demonstrated.
What is the one-line takeaway? Bears in Tohoku enter human space when the beech crop falls below a hunger threshold, lean beech years have grown leaner since 2006, and 2025 was worst because the backup food failed at the same time.
Xiao H, Zhang Z, Miyamoto Y, Ichinose T. "Compound food failure on a deteriorated mast system drives Japan's bear conflict crisis." Science Advances, 2026. doi.org/10.1126/sciadv.aej8134
PubMed PMID: 42777031.
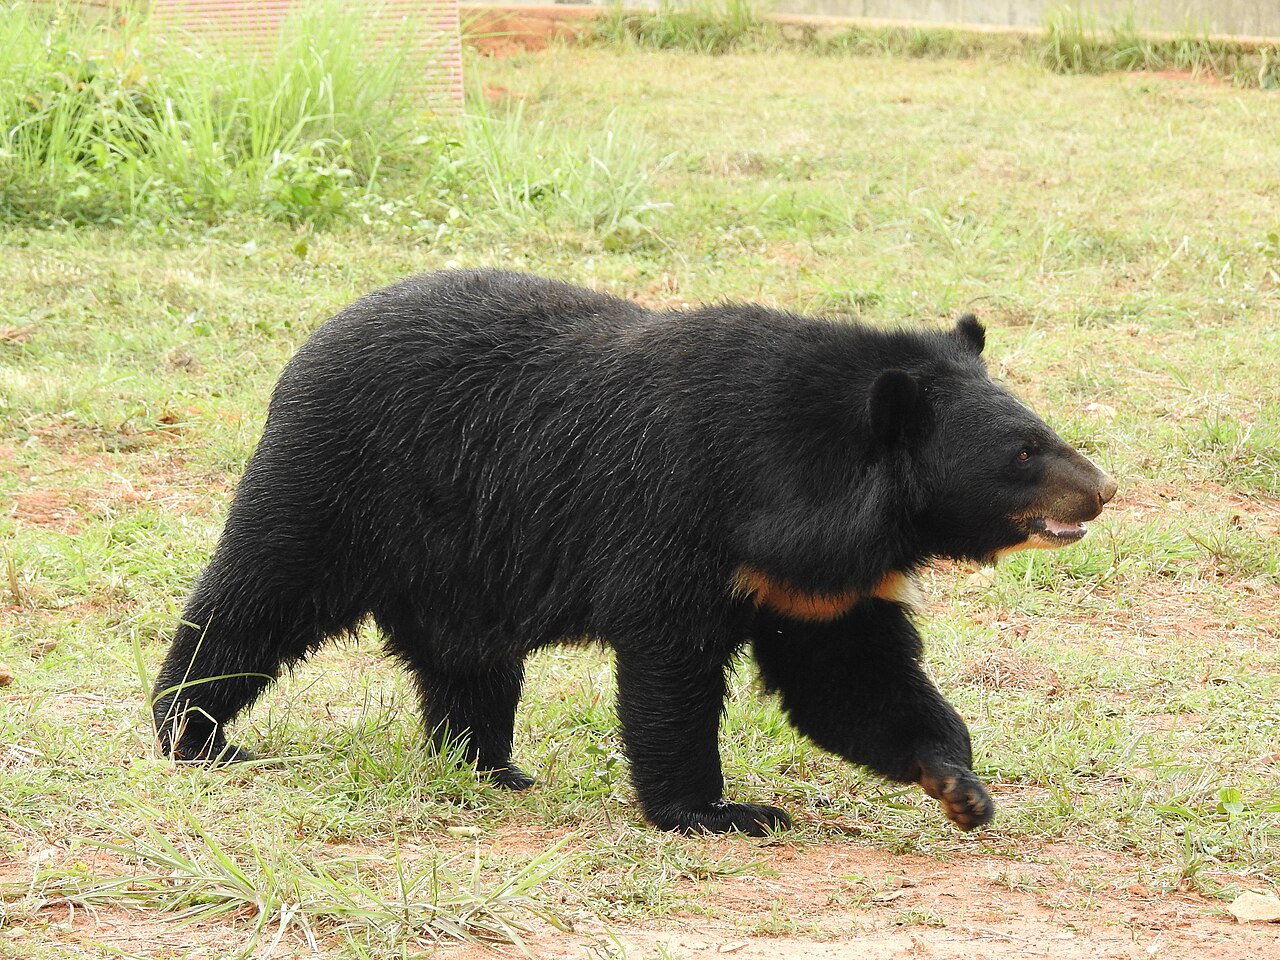
Image: Asiatic black bear (Ursus thibetanus). Dr. Raju Kasambe, CC BY-SA 4.0, via Wikimedia Commons.
Comments